Supervised Classification
in Remote Sensing
Learning Objectives
By the end of this lesson you will be able to:
- Describe the supervised classification pipeline: from labelled ground truth polygons to a full raster map
- Explain the polygon-to-point sampling step: why it is needed in this workflow and what it implies for class balance and spatial autocorrelation
- Explain the spatial autocorrelation problem and why it makes standard accuracy estimates misleading
- Explain the role of feature extraction as the bridge between raster data and any ML algorithm
- Explain why pixel brightness alone often fails, and how spatial texture addresses this limitation
- Distinguish overall accuracy, producer’s accuracy, and user’s accuracy — and what each tells a map-maker
Introduction
What makes RS classification different?
- Spatial structure: pixels are not independent — spatial autocorrelation matters
- Scale of prediction: we predict on entire rasters (millions of pixels), not just point datasets
- Spatial sampling: ground truth comes from polygons, requiring careful sampling strategies
- Feature engineering: spatial context (focal operations) is critical, not just pixel values
Data
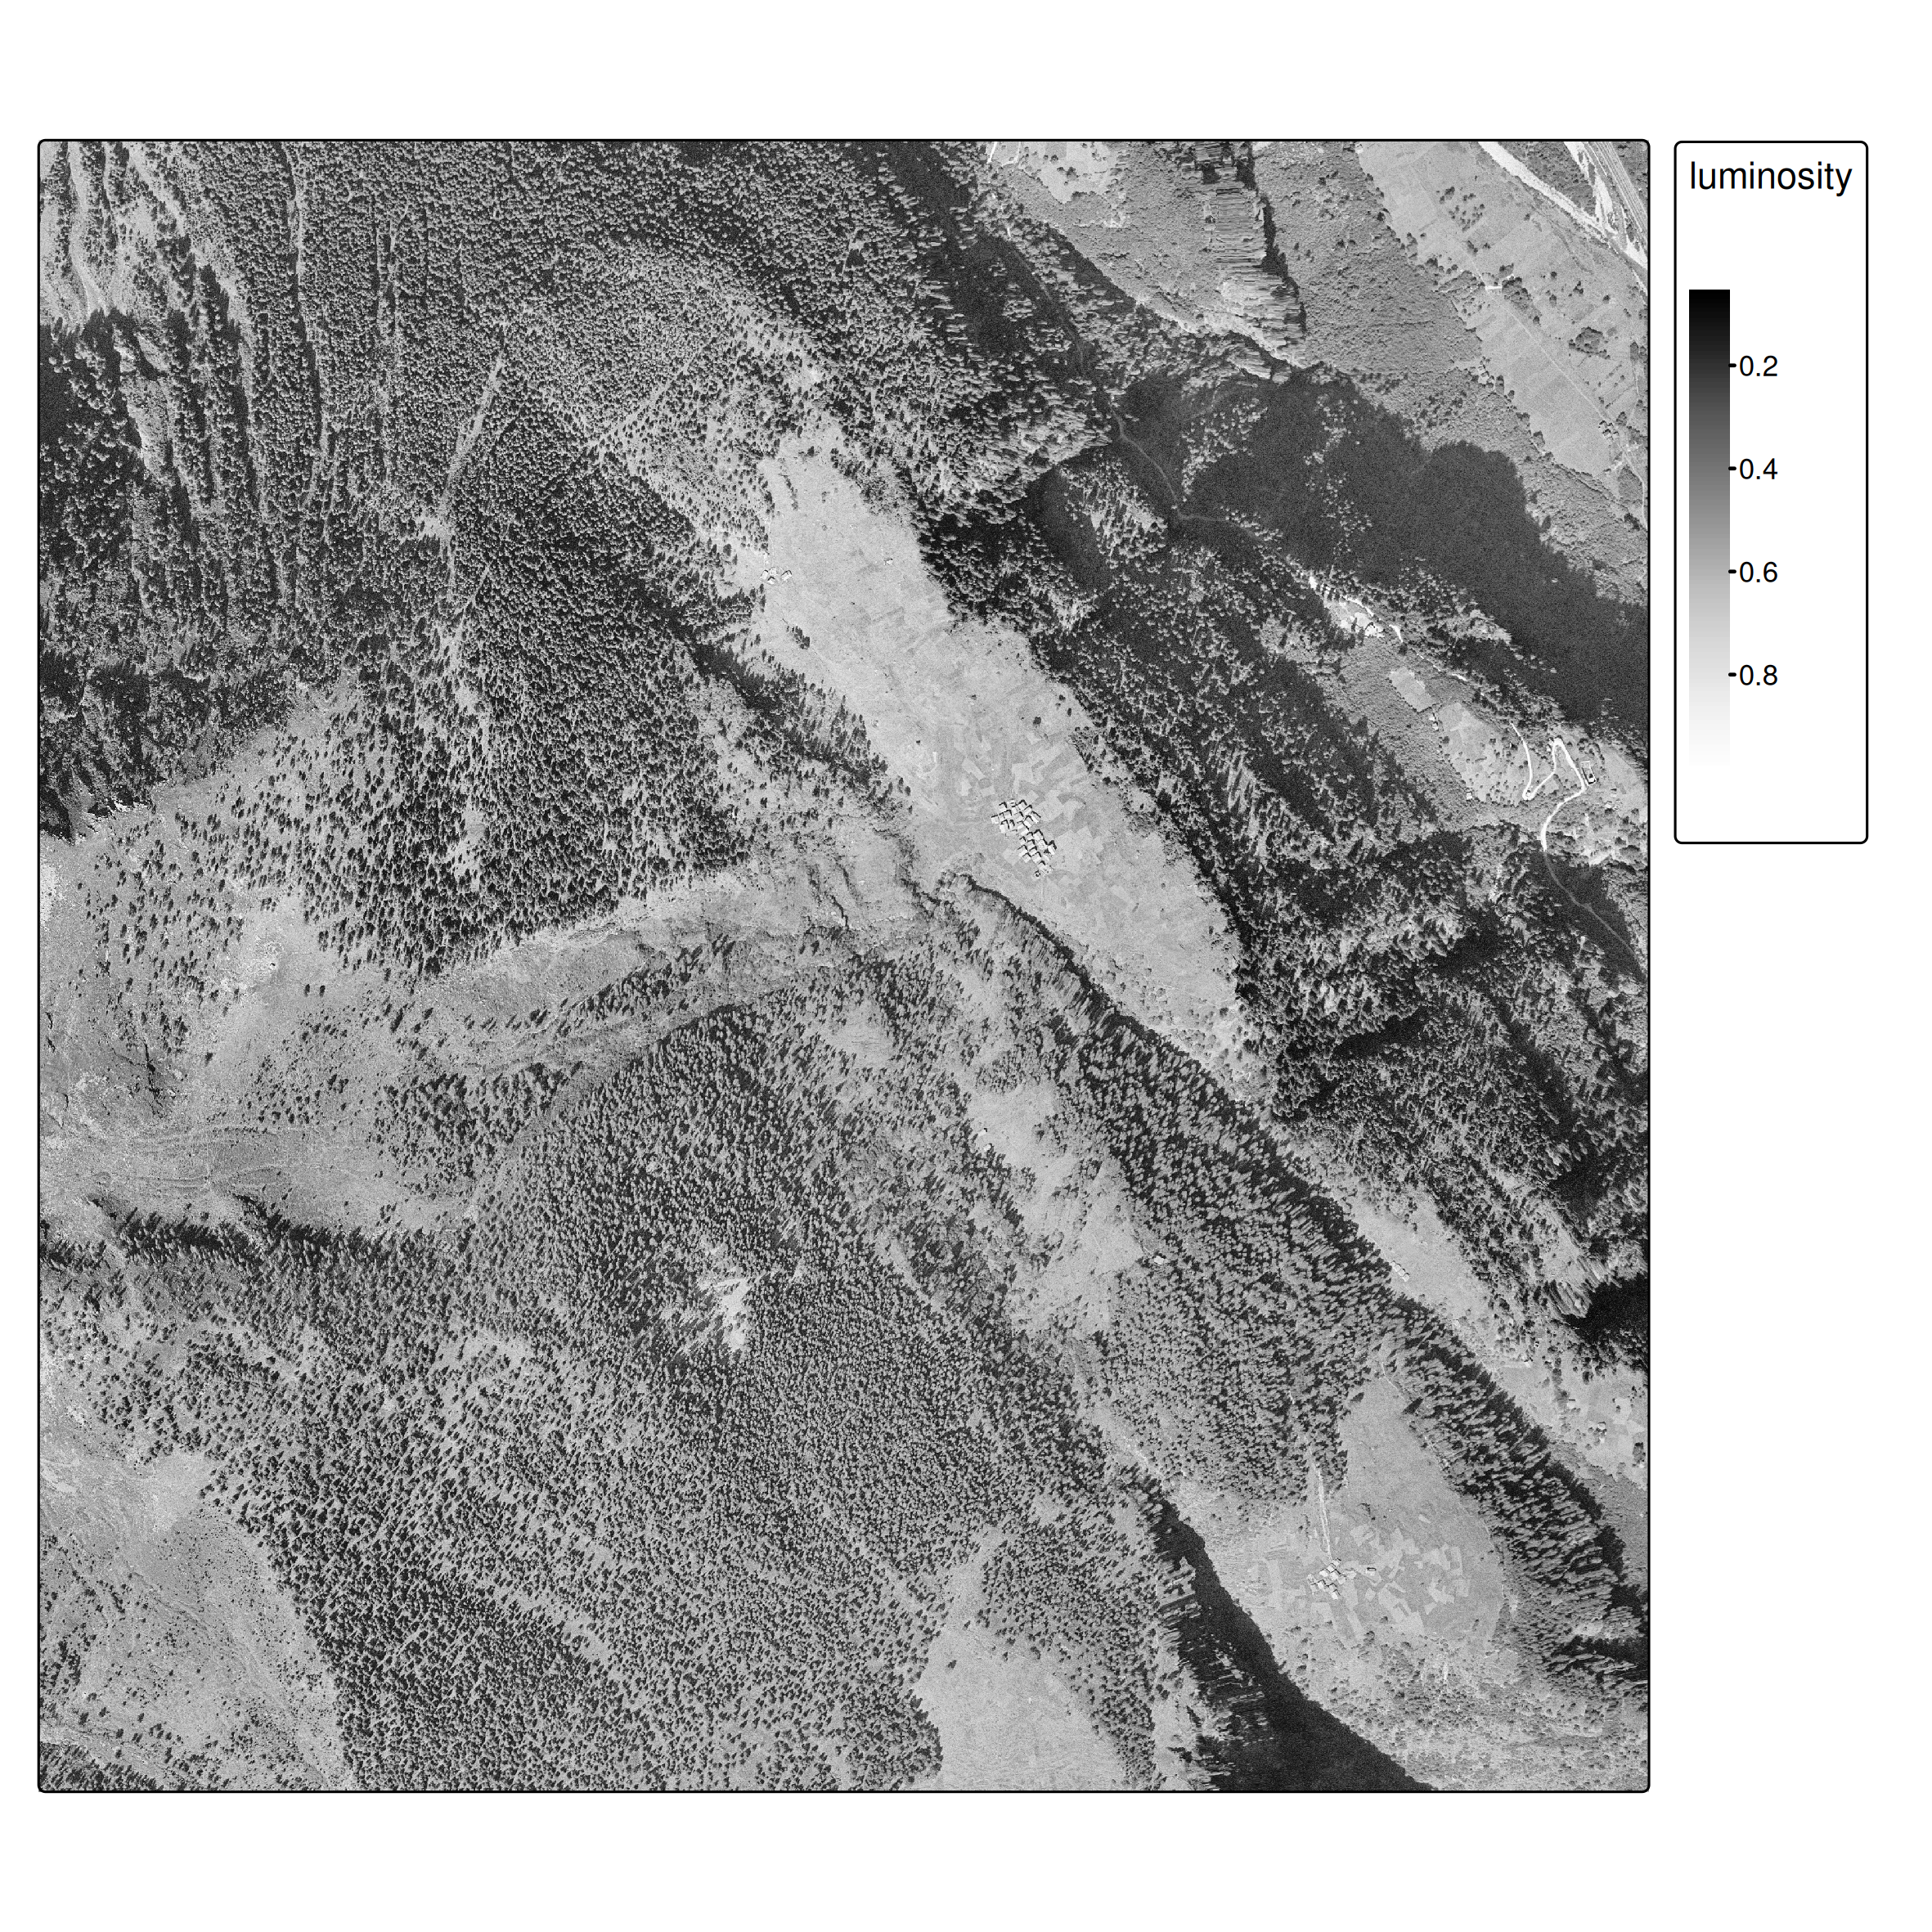
- Historic aerial imagery from 1961 (swisstopo)
- Single band (grayscale), 0.5 m/pixel resolution
- Images available for: 1961, 1971, 1977, 1983, 1989, 1995
- Ground truth forest polygons (hand-digitized)
Workflow Overview
- Load ground truth polygons and generate point samples
- Spatial train/test split (⚠ autocorrelation)
- Extract raster features using
extract() - Train classifier (CART for interpretability)
- Predict on entire raster
- Evaluate and compare approaches
Ground Truth & Spatial Sampling
From polygons to points
Unlike standard ML datasets, our ground truth comes as spatial polygons.
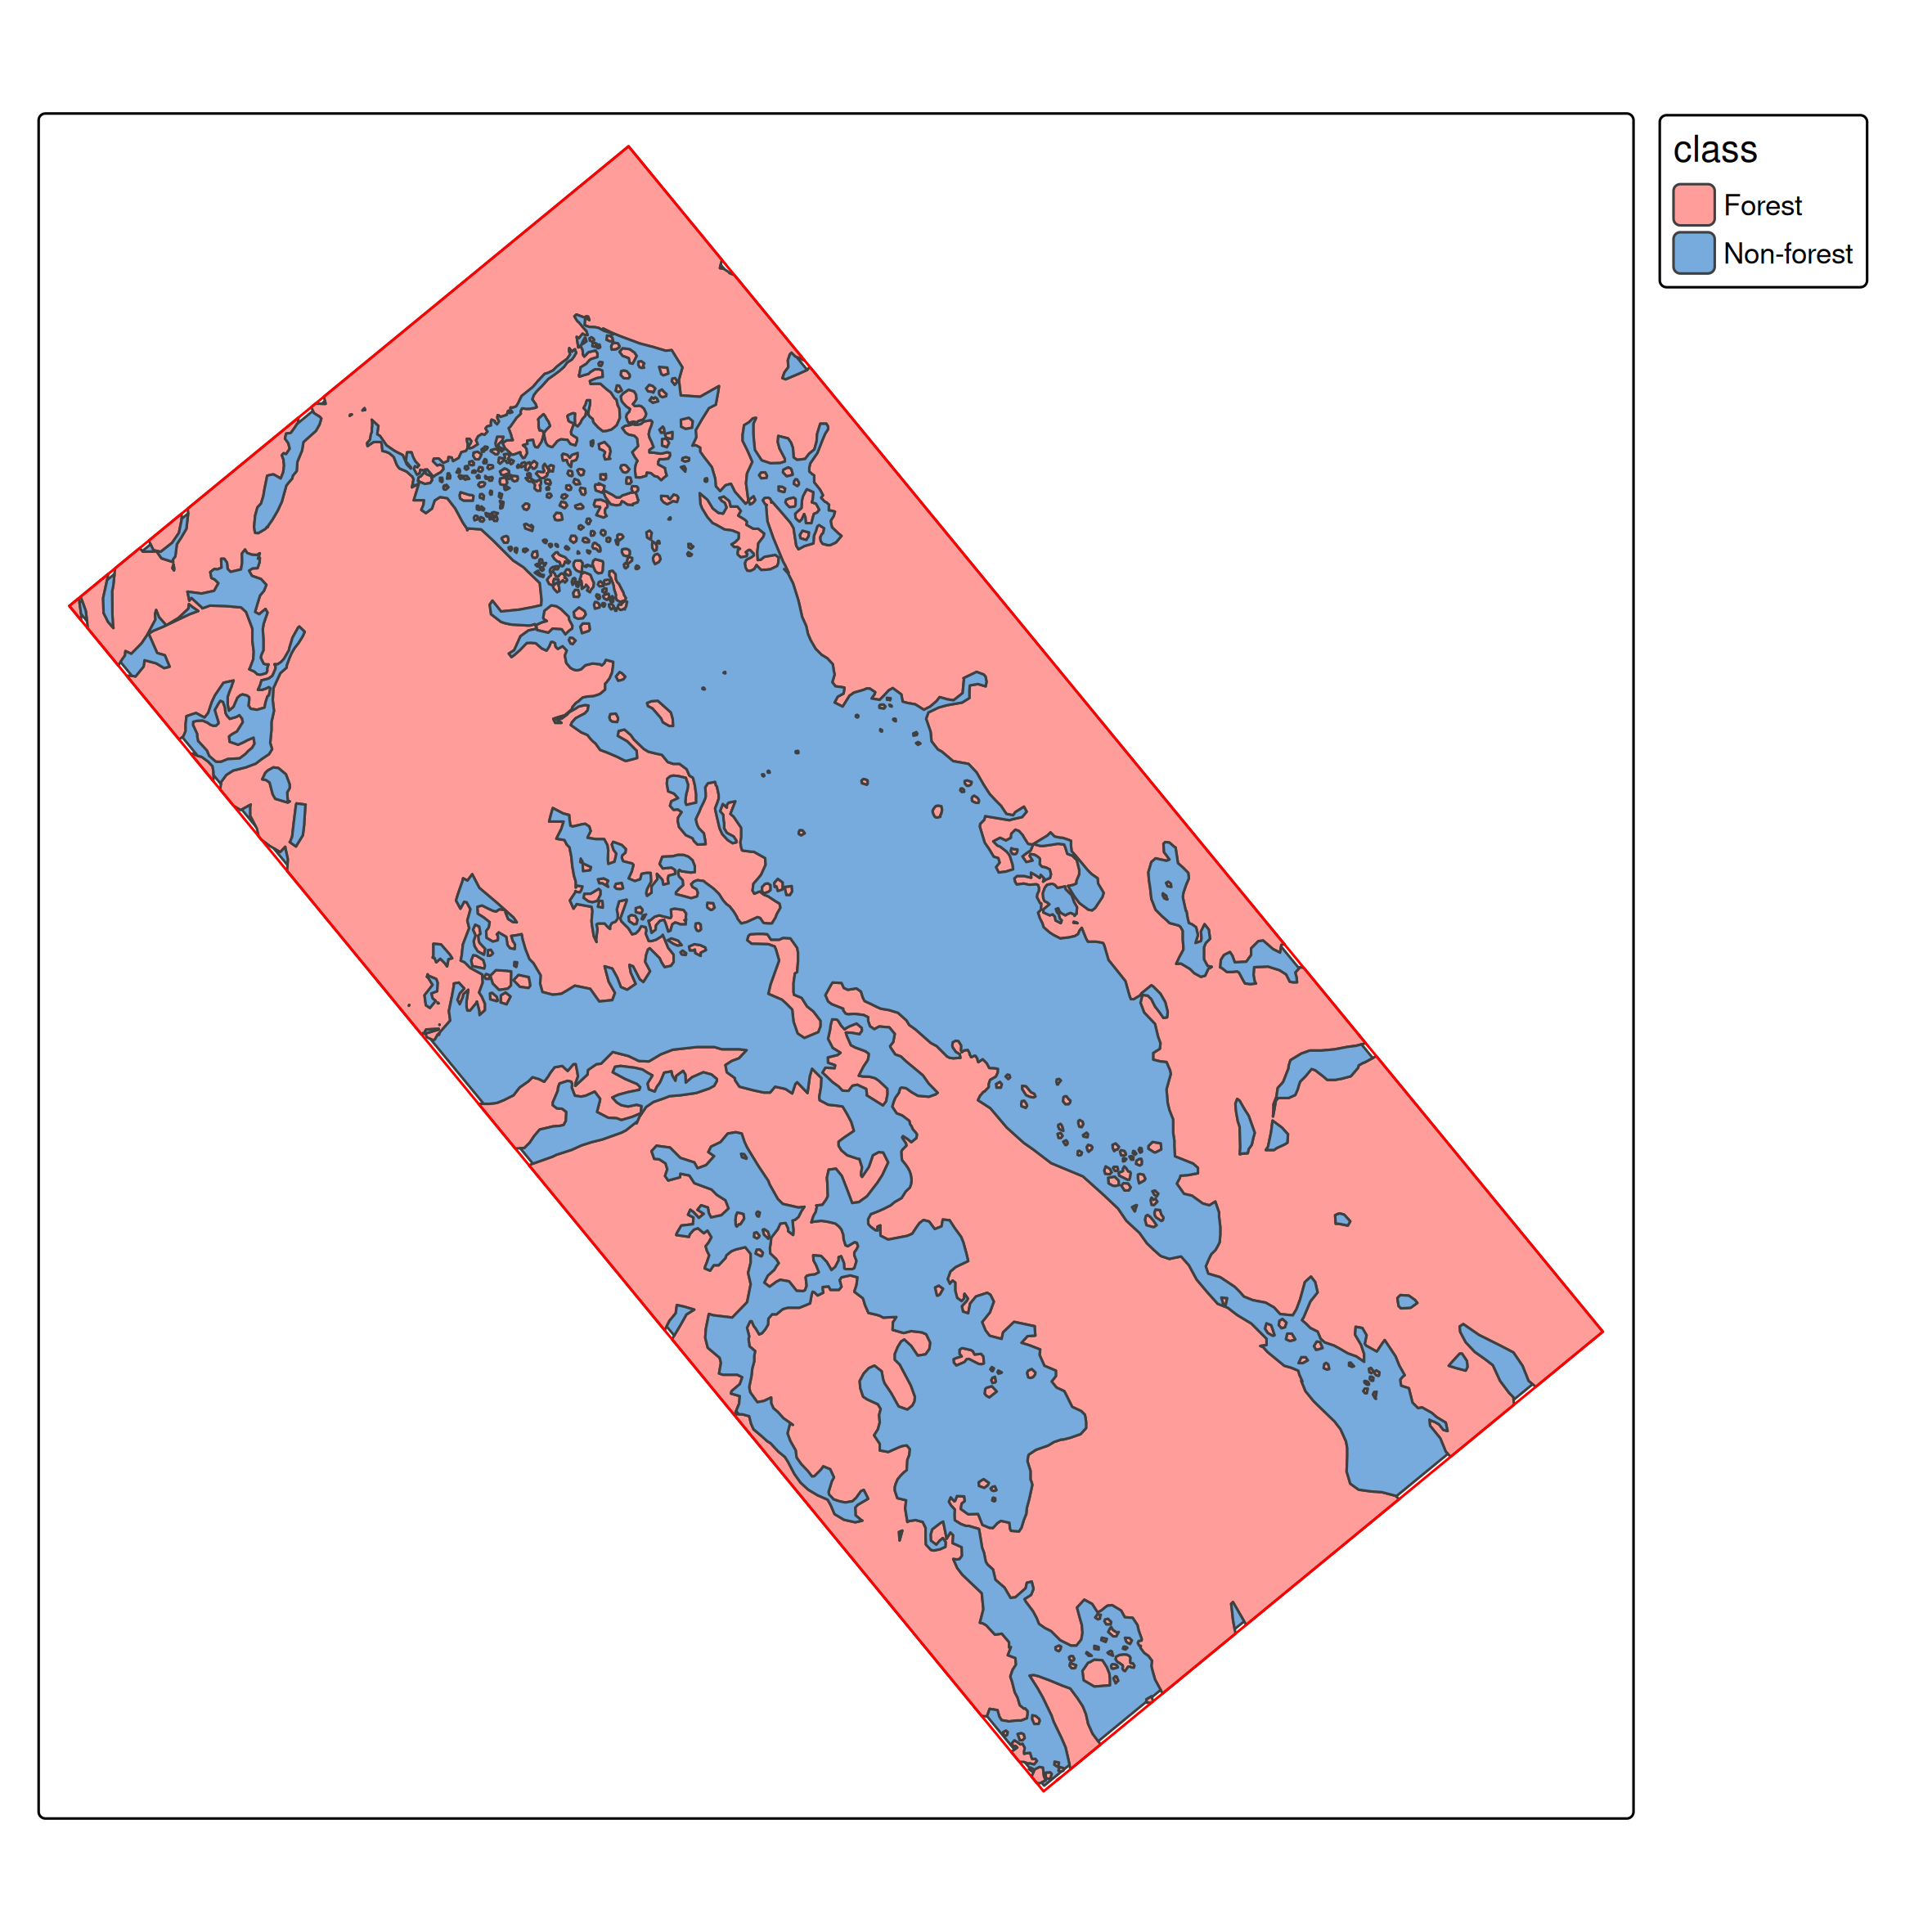
We need point samples for training:
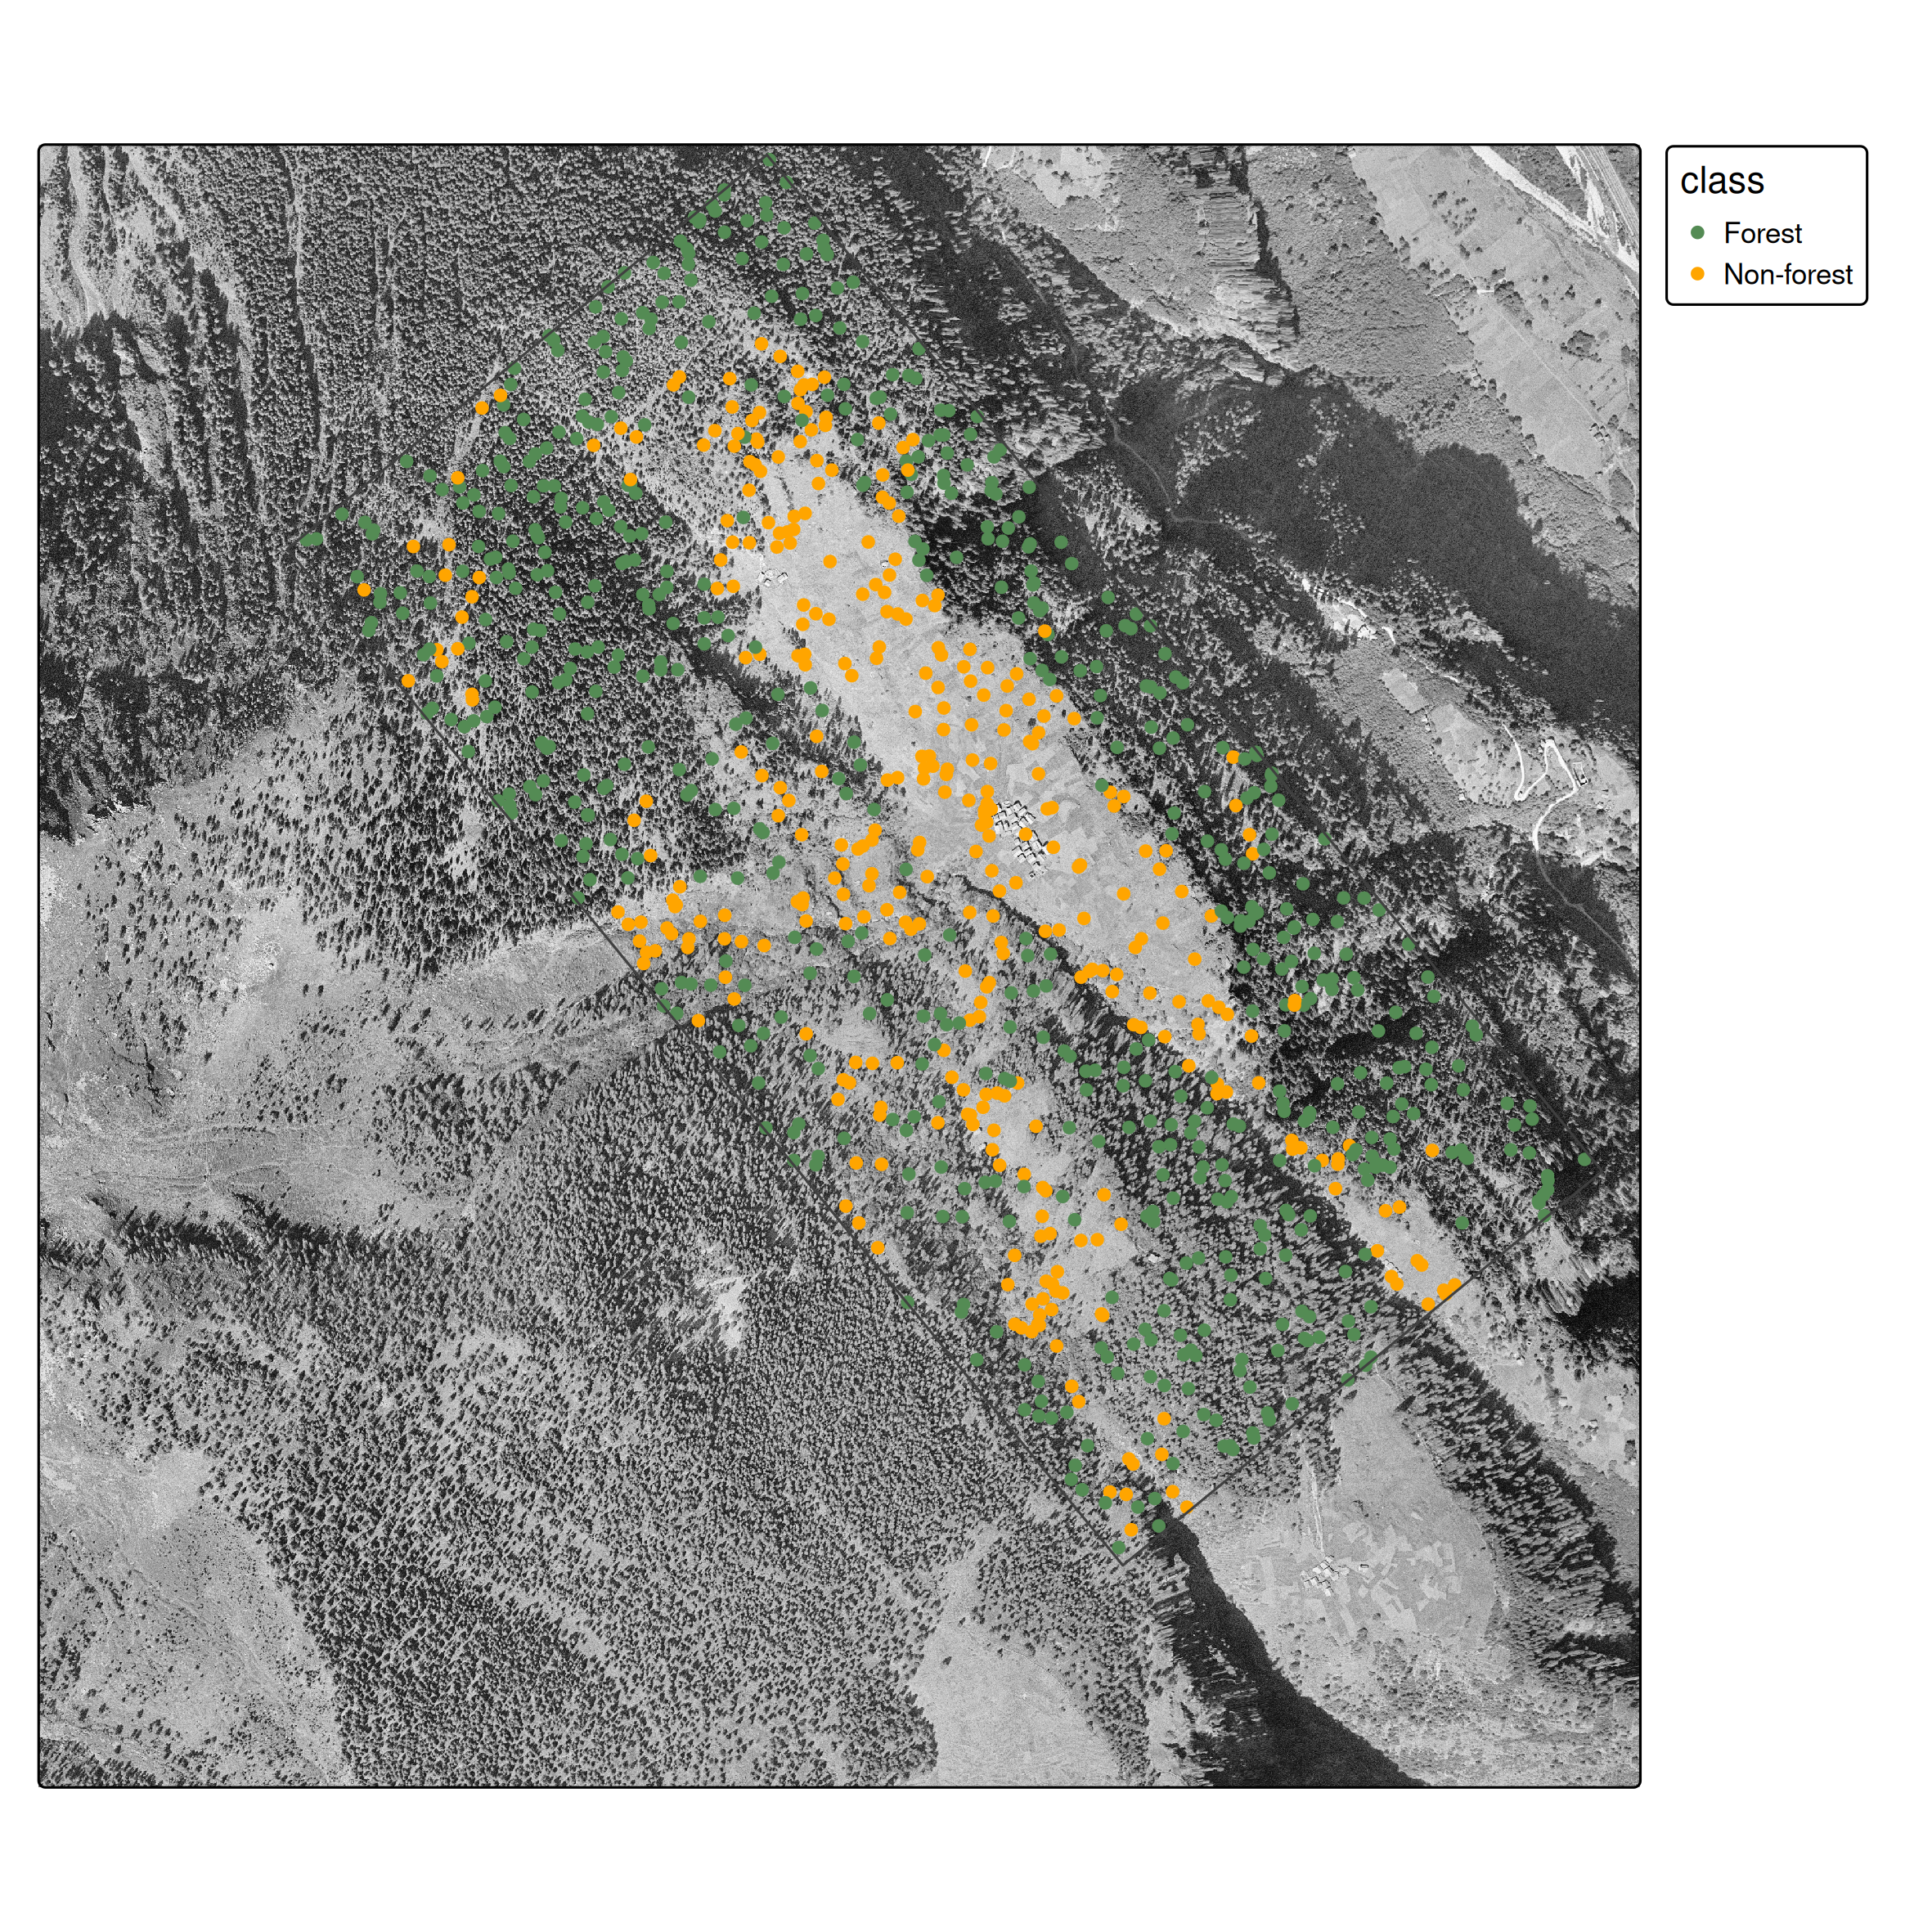
Sample points from forest (green) and non-forest (orange) polygons
st_sample() draws random points within each polygon geometry.
st_join() does a spatial left join — for each point it finds the polygon that contains it and copies over the attributes (class, etc.).
Result: an sf data frame where every row is a labelled point with known coordinates.
Train/test split: The spatial autocorrelation problem
Important
Spatial autocorrelation issue: Random splits violate independence assumptions because nearby pixels are correlated. Proper approaches use spatial cross-validation (Brenning 2023; Schratz et al. 2021). We use random splits here for simplicity, but be aware this may overestimate performance.
- 70 / 30 split is a common heuristic
set.seed()makes the result reproducible- Both sets retain their geometries — we still know where each point is on the map
Approach 1: Single-Band Classifier
Feature extraction
terra::extract() samples raster values at each point location:
# A tibble: 10 × 2
   class      luminosity
   <fct>           <dbl>
 1 Non-forest     0.635
 2 Forest         0.208
 3 Forest         0.396
 4 Forest         0.298
 5 Forest         0.129
 6 Non-forest     0.698
 7 Forest         0.0863
 8 Non-forest     0.741
 9 Forest         0.325
10 Forest         0.275
From spatial to tabular
After feature extraction, the spatial complexity is gone — we have a plain data frame:
| class | luminosity |
|---|---|
| Forest | 0.38 |
| Non-forest | 0.74 |
| Forest | 0.41 |
| … | … |
From here, any standard ML algorithm applies. The spatial awareness is only needed again at prediction time, when we apply the model back to the full raster.
Training
We use CART (decision trees) for interpretability. As experienced ML practitioners, feel free to substitute with Random Forest, XGBoost, etc.
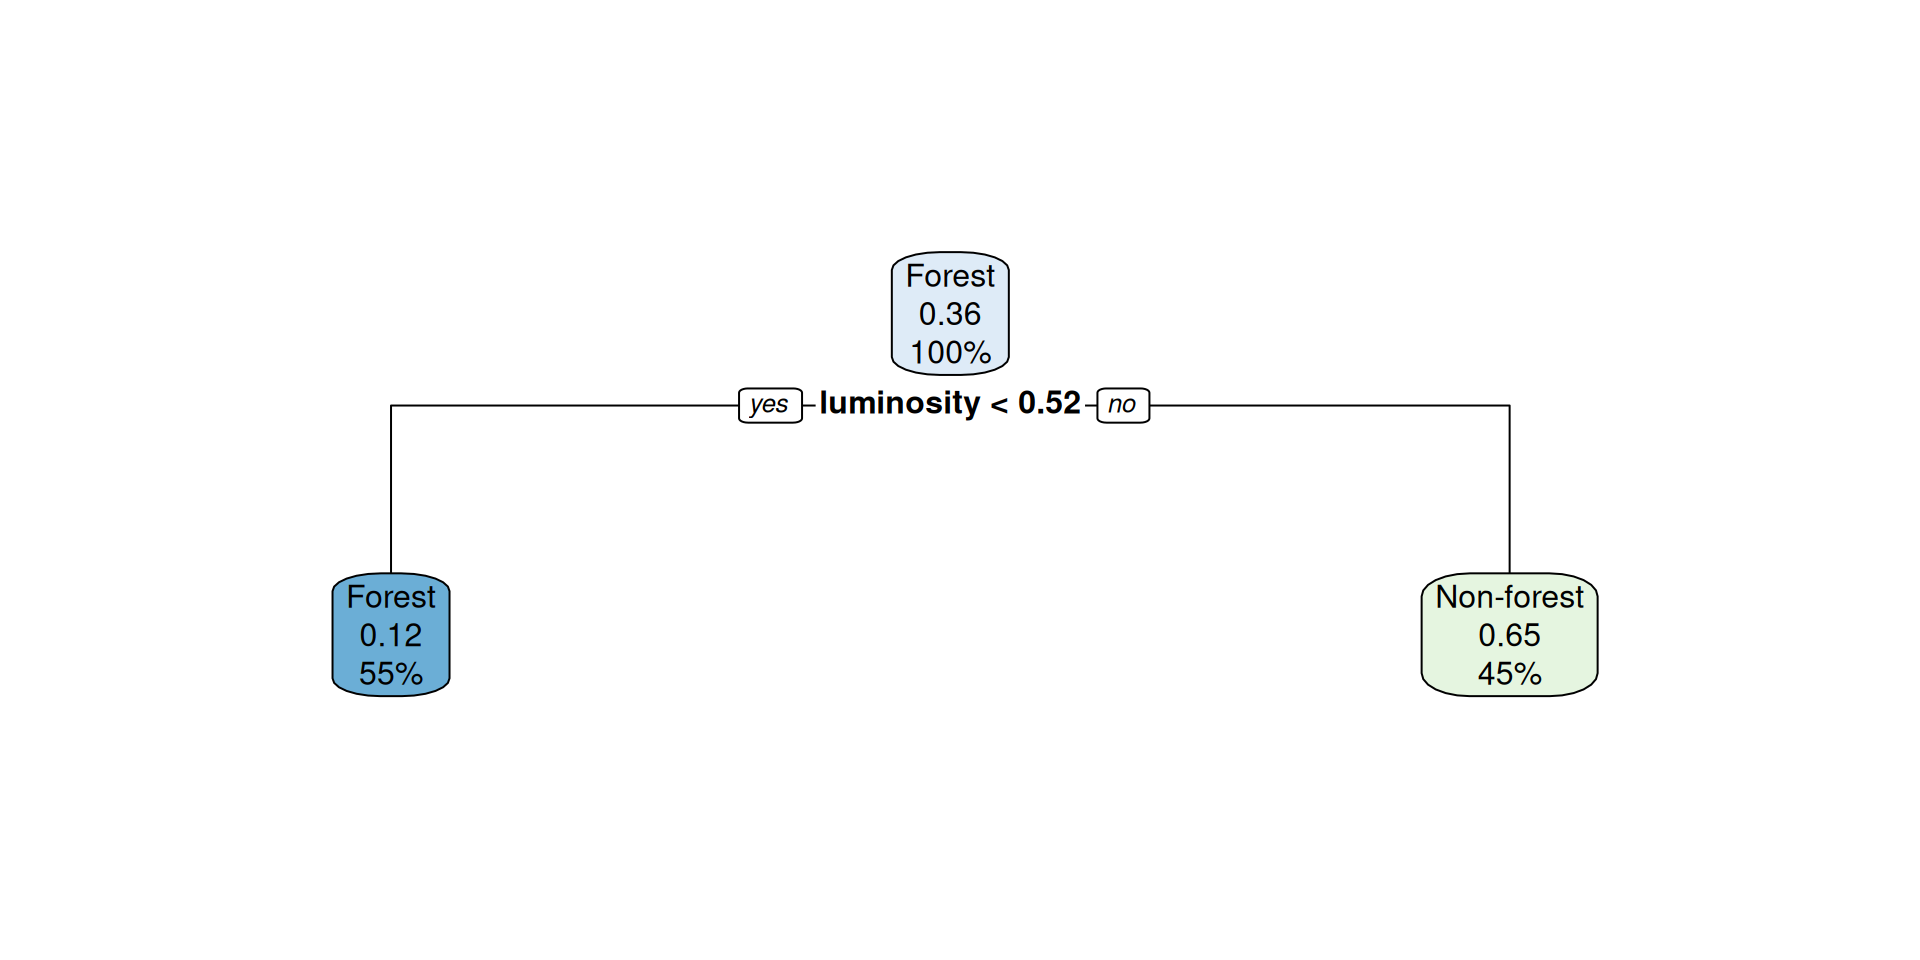
Figure 1: Decision tree for single-band classification
Raster prediction
How terra::predict() works
Conceptually: iterate over every pixel, build a one-row data frame of its values, call predict(model, newdata = ...), write the result back.
for each pixel (i, j):
    features <- extract value(s) at (i, j)
    probs    <- predict(model, newdata = features, type = "prob")
output[i, j] <- probs- Output of
predict(raster, model, type = "prob"): one layer per class, values = probabilities which.max()returns an integer raster: which layer has the highest probability?
Setting categorical levels
which.max() returns integers (1, 2, …). To get meaningful labels:
- The layer order matches the alphabetical order of factor levels in the training data
- Without this step the result raster only contains 1s and 2s

Classification result — single band approach
Evaluation
Before showing the numbers: how to read a confusion matrix
| Actual: Forest | Actual: Non-forest | |
|---|---|---|
| Predicted: Forest | TP | FP |
| Predicted: Non-forest | FN | TN |
- Overall accuracy = (TP + TN) / total
- Producer’s accuracy (recall) = TP / (TP + FN) — “of actual forest, how much did we catch?”
- User’s accuracy (precision) = TP / (TP + FP) — “when we predict forest, how often is it right?”
Actual
|
||
|---|---|---|
| Forest | Non-forest | |
| Forest | 137 | 22 |
| Non-forest | 55 | 87 |
Overall accuracy: 0.74
The Spatial Context Problem
Why pixel-based classification struggles
- At pixel level, it is hard to distinguish forest from non-forest
- Spatial context is essential: humans use texture, patterns, and neighborhoods to classify land cover
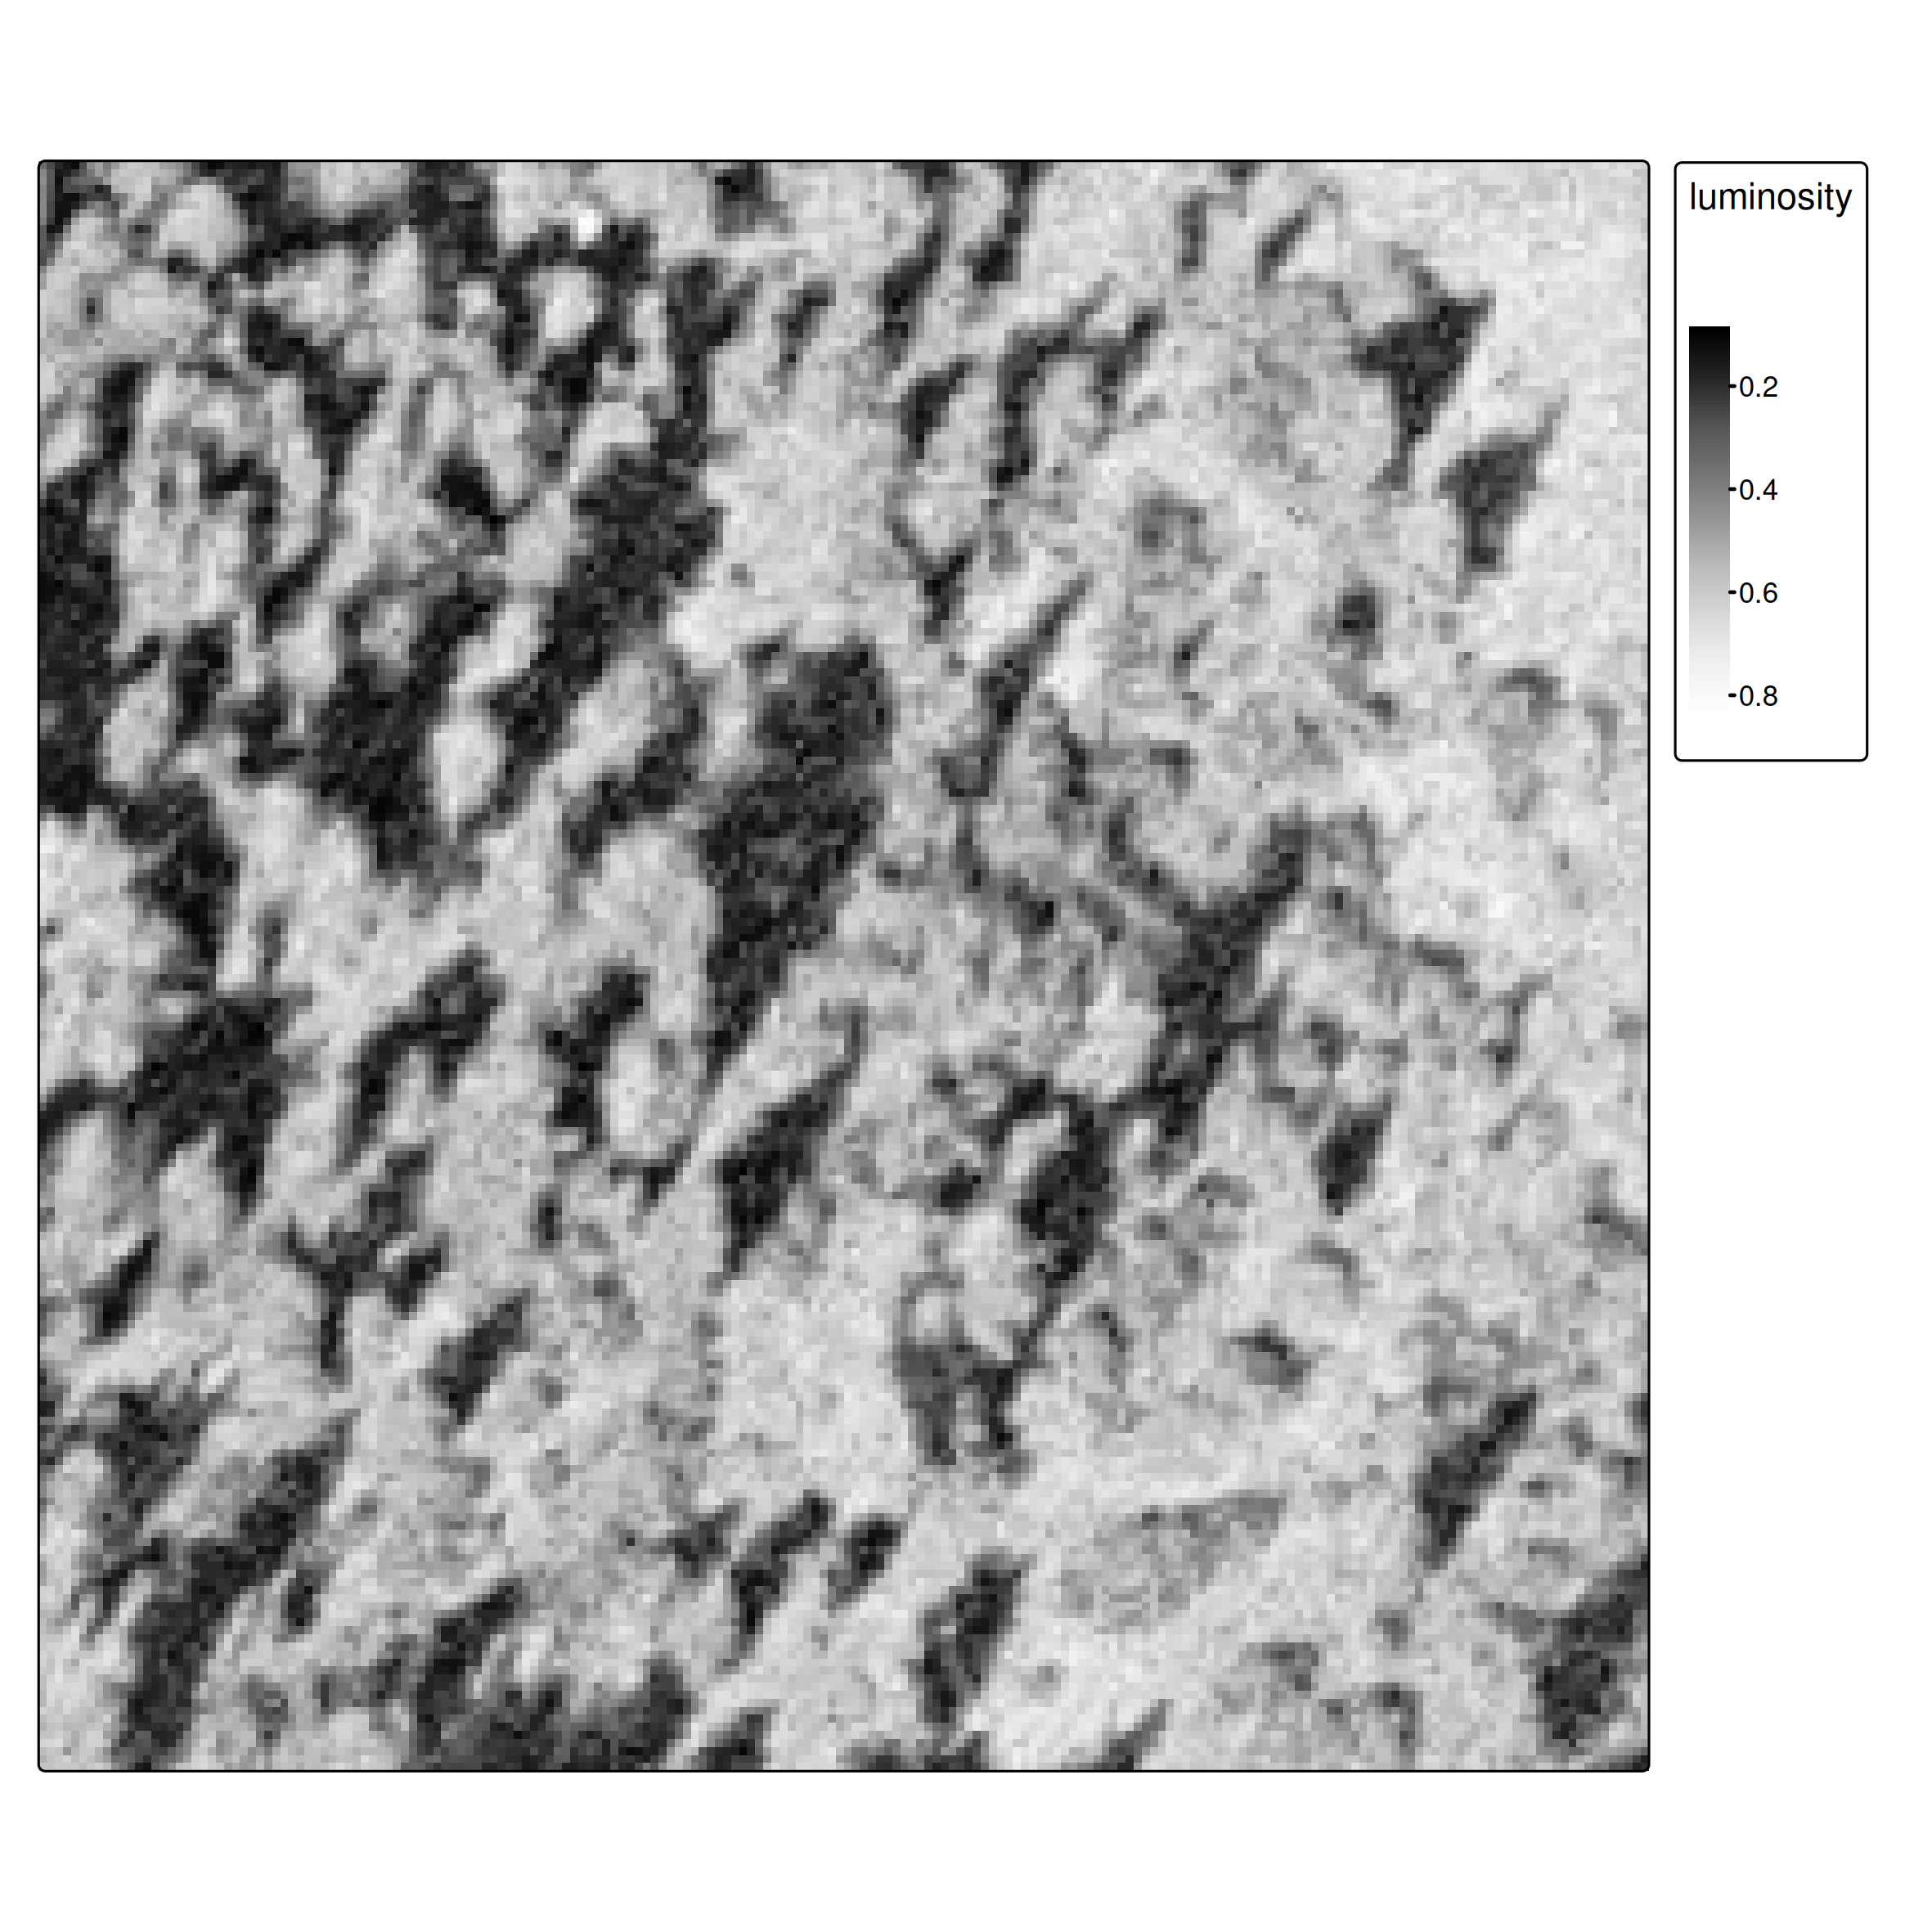
Figure 2
Approach 2: Adding Spatial Features
Focal operations as feature extractors
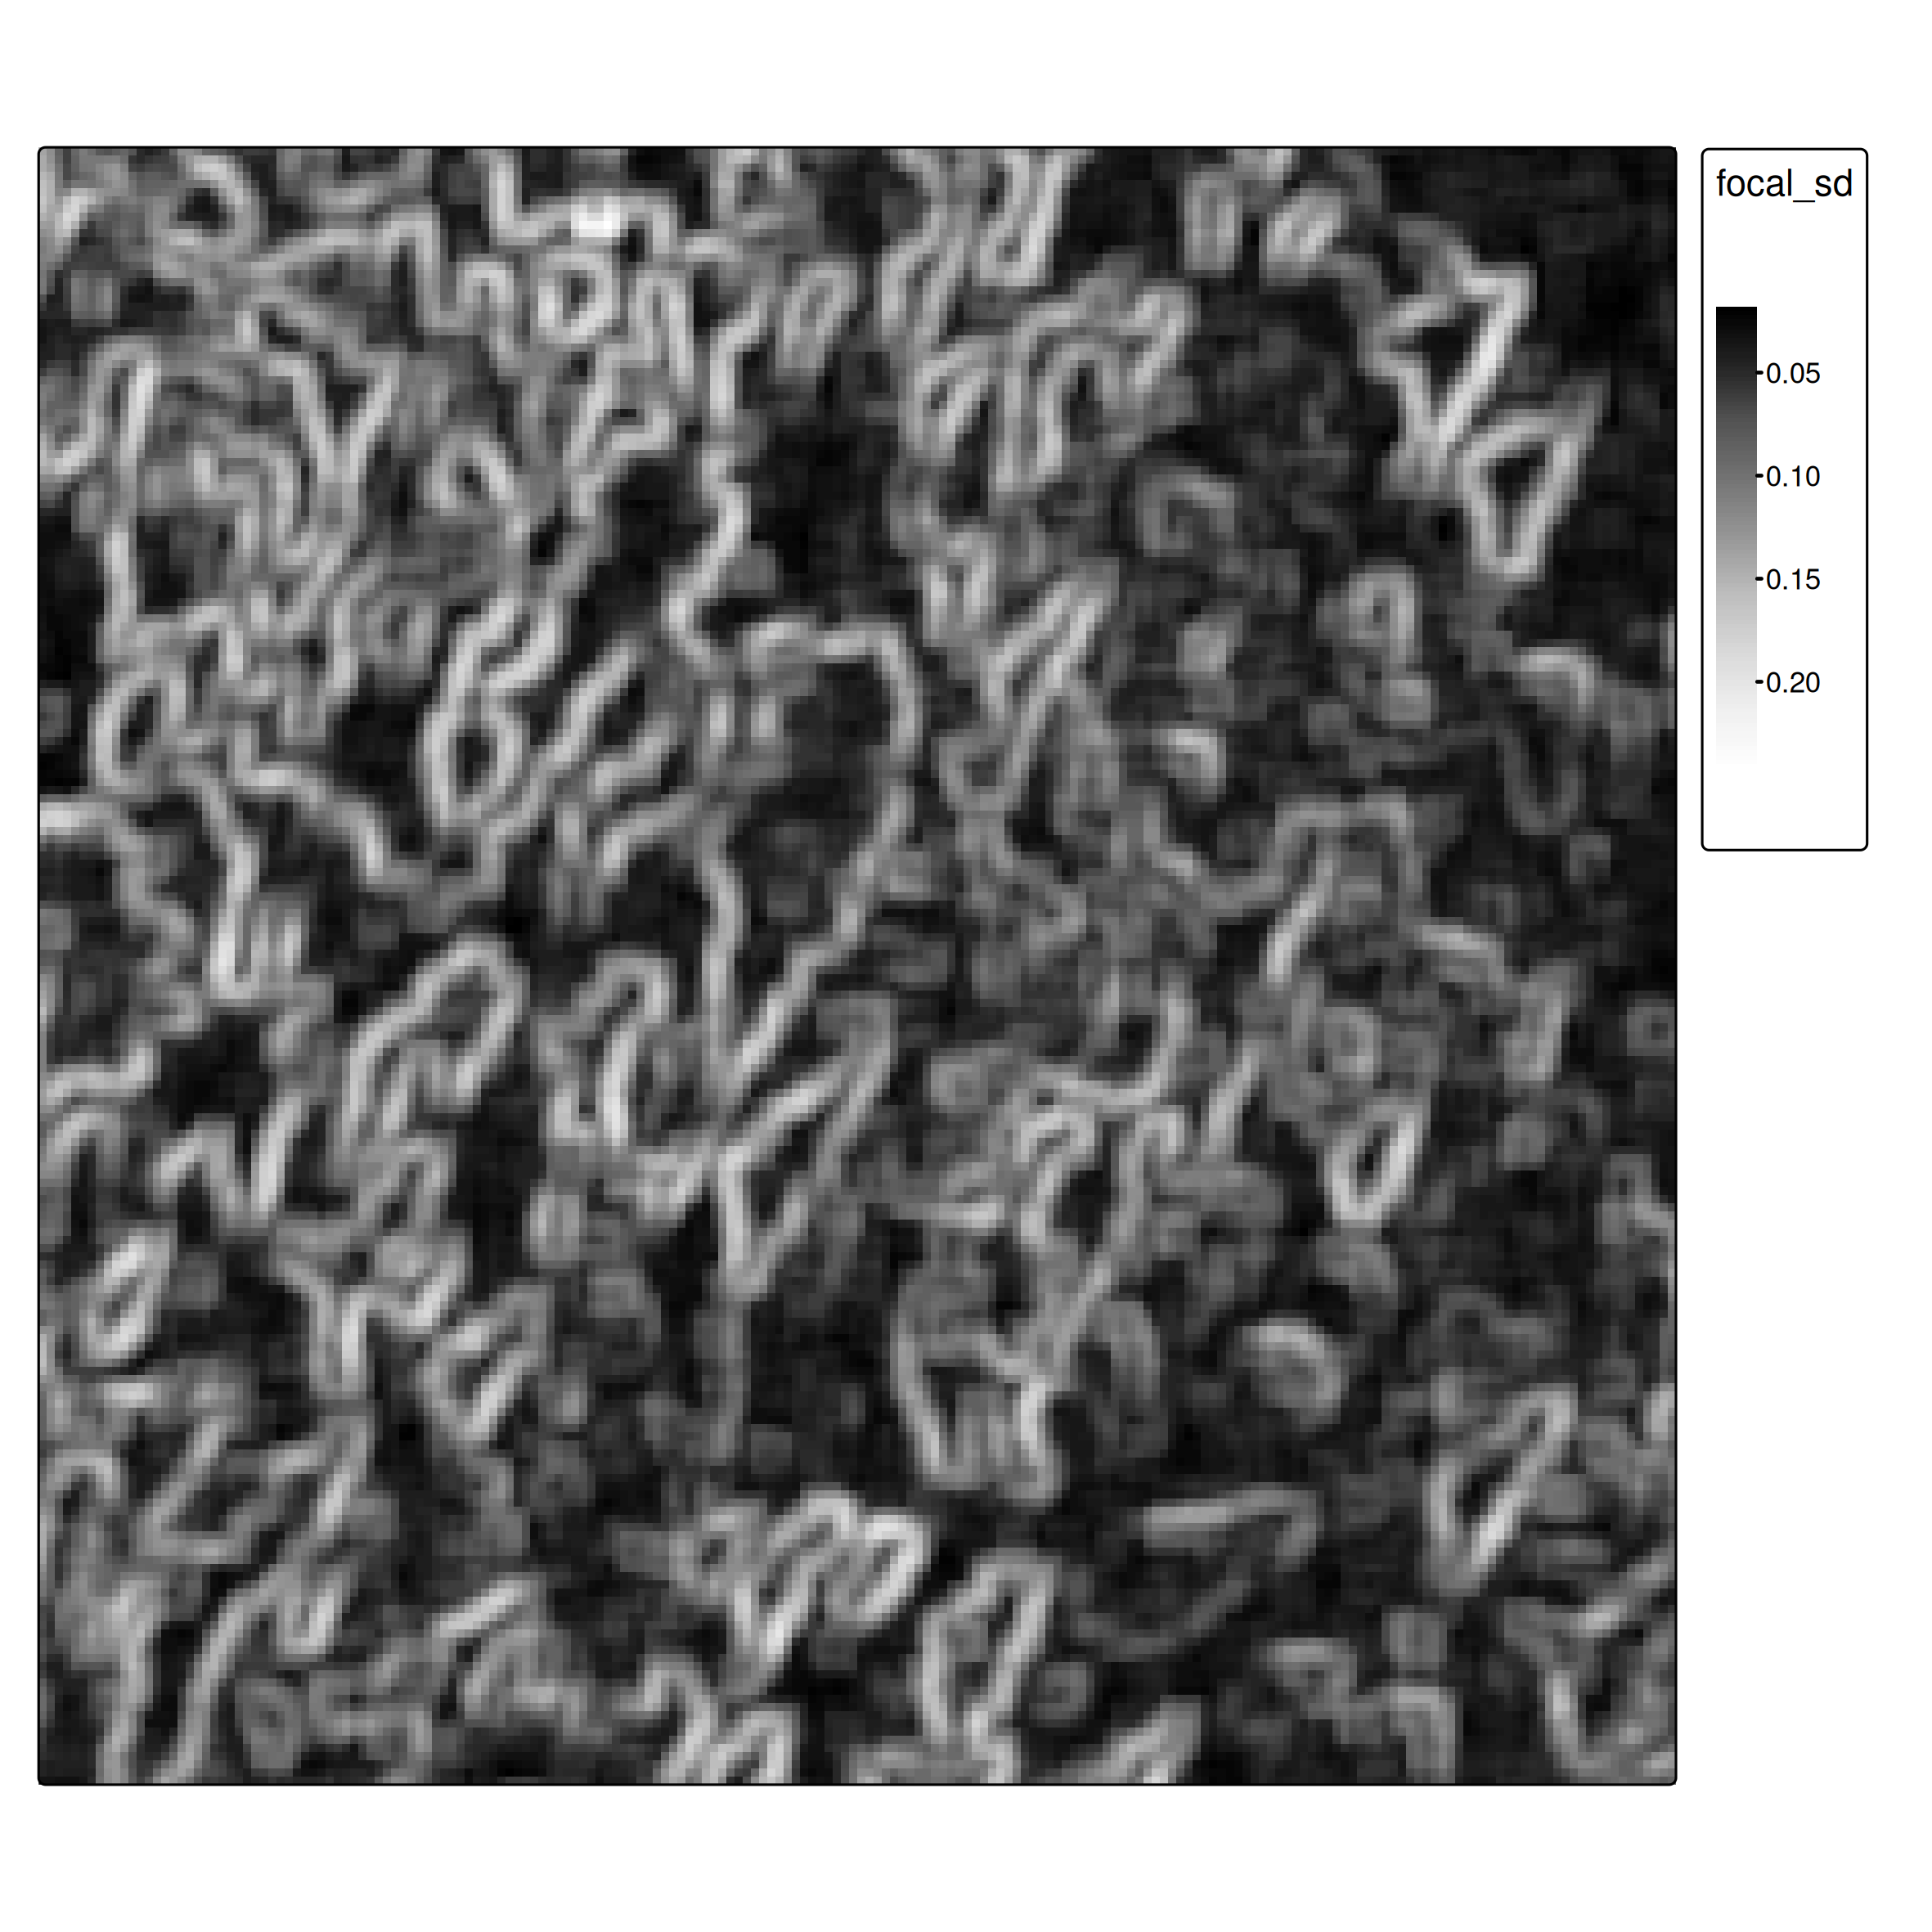
Focal operations aggregate neighborhood values, providing spatial context:
- High SD → heterogeneous neighborhood → likely a forest edge or textured canopy
- Low SD → uniform neighborhood → likely open field or dense uniform forest
Normalization for multi-feature learning
When combining features with different scales, normalize to [0, 1] using min-max scaling:
\[x' = \frac{x - \min(x)}{\max(x) - \min(x)}\]
minmax_normalization <- function(x){
  minmax_vals <- minmax(x)[,1]
  (x - minmax_vals[1]) / (minmax_vals[2] - minmax_vals[1])
}

ces1961_focal_sd <- minmax_normalization(ces1961_focal_sd)

# Stack: now a 2-band raster
ces_multi <- c(ces1961, ces1961_focal_sd)
names(ces_multi) <- c("luminosity", "focal_sd")
Why normalize? Decision trees are invariant to scale, but other algorithms (SVM, KNN, neural networks) are not. It’s good practice regardless.
Training with spatial features
The call is identical — rpart just sees more columns now:
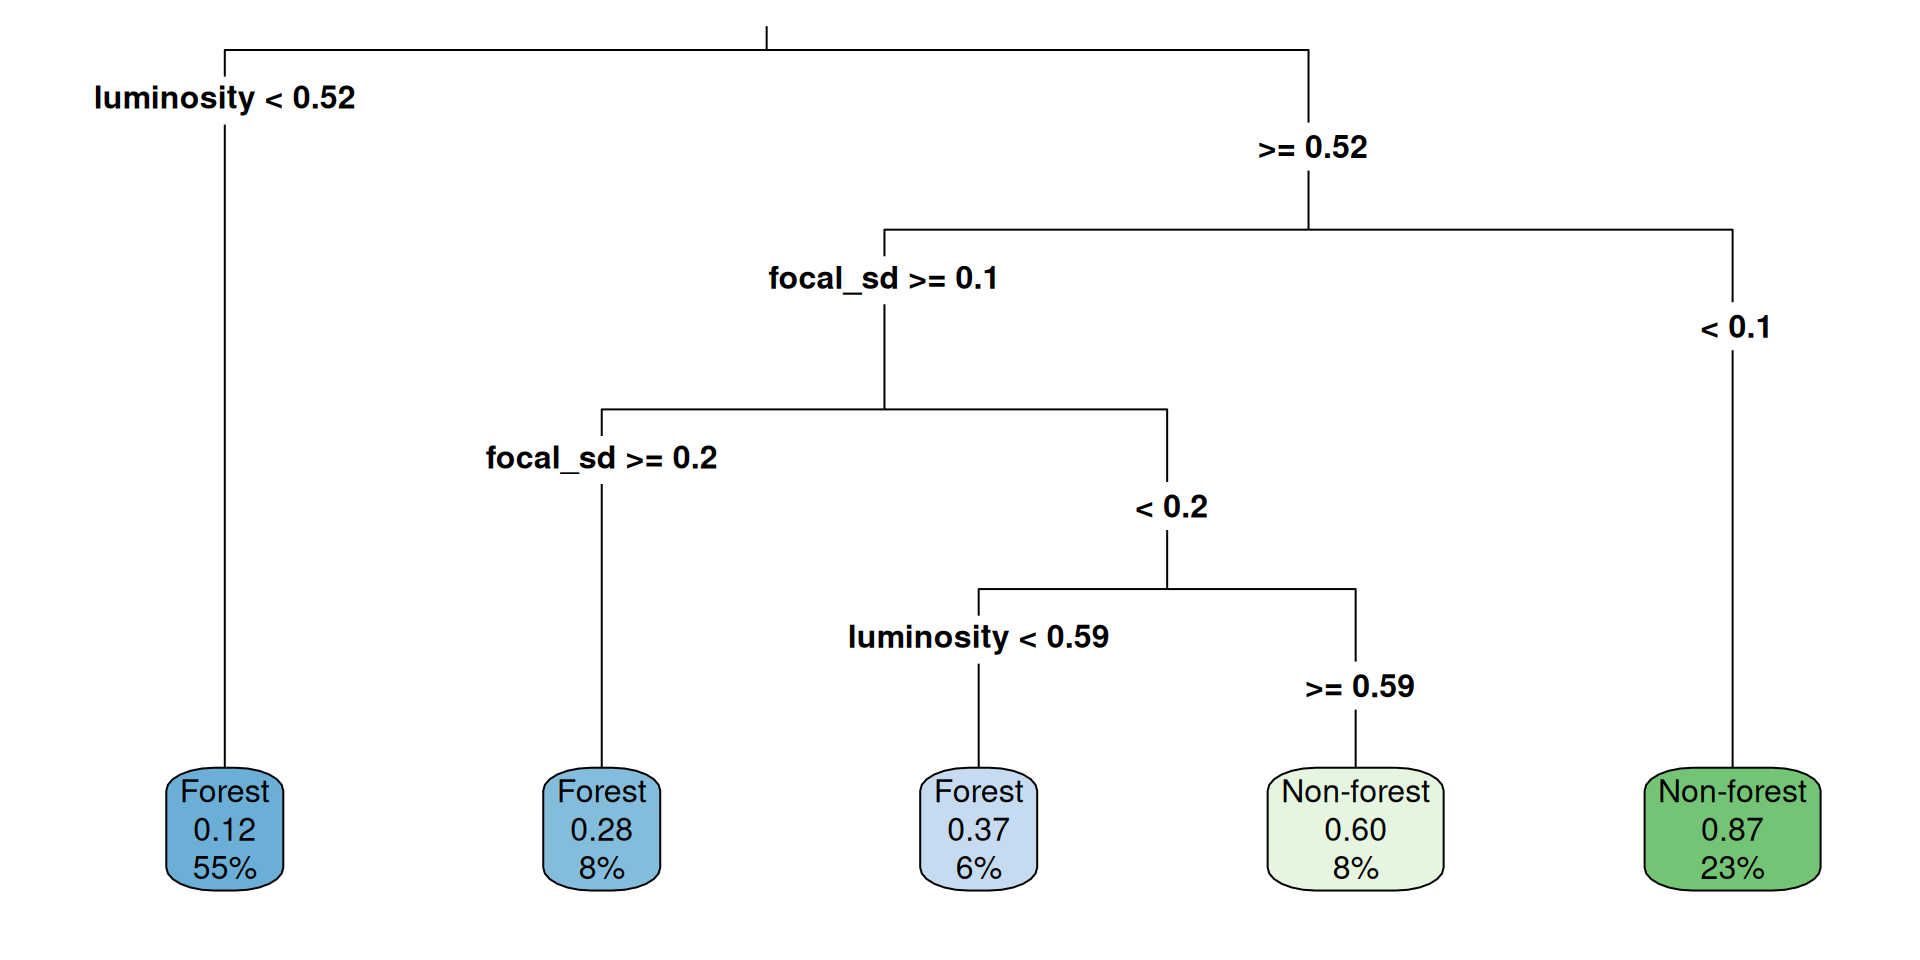
Figure 4: Decision tree now uses both luminosity and spatial texture
Prediction and evaluation
Actual
|
||
|---|---|---|
| Forest | Non-forest | |
| Forest | 175 | 37 |
| Non-forest | 17 | 72 |
Overall accuracy: 0.82 (vs. 0.74 without spatial features)
What did we gain?
| Features | Overall accuracy | |
|---|---|---|
| Approach 1 | luminosity | 0.74 |
| Approach 2 | luminosity + focal SD | 0.82 |
The texture feature captures local variation — forest canopy looks rougher at 0.5 m resolution than agricultural fields or roads.
One extra focal operation nearly free-rides on the existing workflow — same model, same extraction, same prediction step.
Further improvements
For advanced applications, consider:
- More focal features: mean, local range, edge-detection filters (Sobel, Laplacian)
- Multi-scale features: focal operations at different window sizes (5×5, 15×15, 31×31)
- Deep learning: CNNs learn optimal spatial filters automatically — no manual feature engineering
- Object-based classification: segment the image first, then classify segments rather than pixels
- Proper spatial CV: use spatial blocking for more realistic accuracy estimates